Custom Dashboards
This guide explains how to create your own dashboards, add widgets, and choose the metrics and visualization types that best suit your needs.
Table of Contents
- Overview
- Creating a New Dashboard
- Adding a Widget
- Step 1 — Choose an Object
- Step 2 — Choose a Metric
- Step 3 — Choose a Widget Type
- Rearranging Widgets (Drag & Drop)
- Filtering by Date and Zone
- Removing a Widget
- Renaming or Deleting a Dashboard
1. Overview
Distritour lets you create custom dashboards in addition to the default dashboard. Each custom dashboard is made up of widgets that you freely choose from multiple objects, metrics, and visualization types.
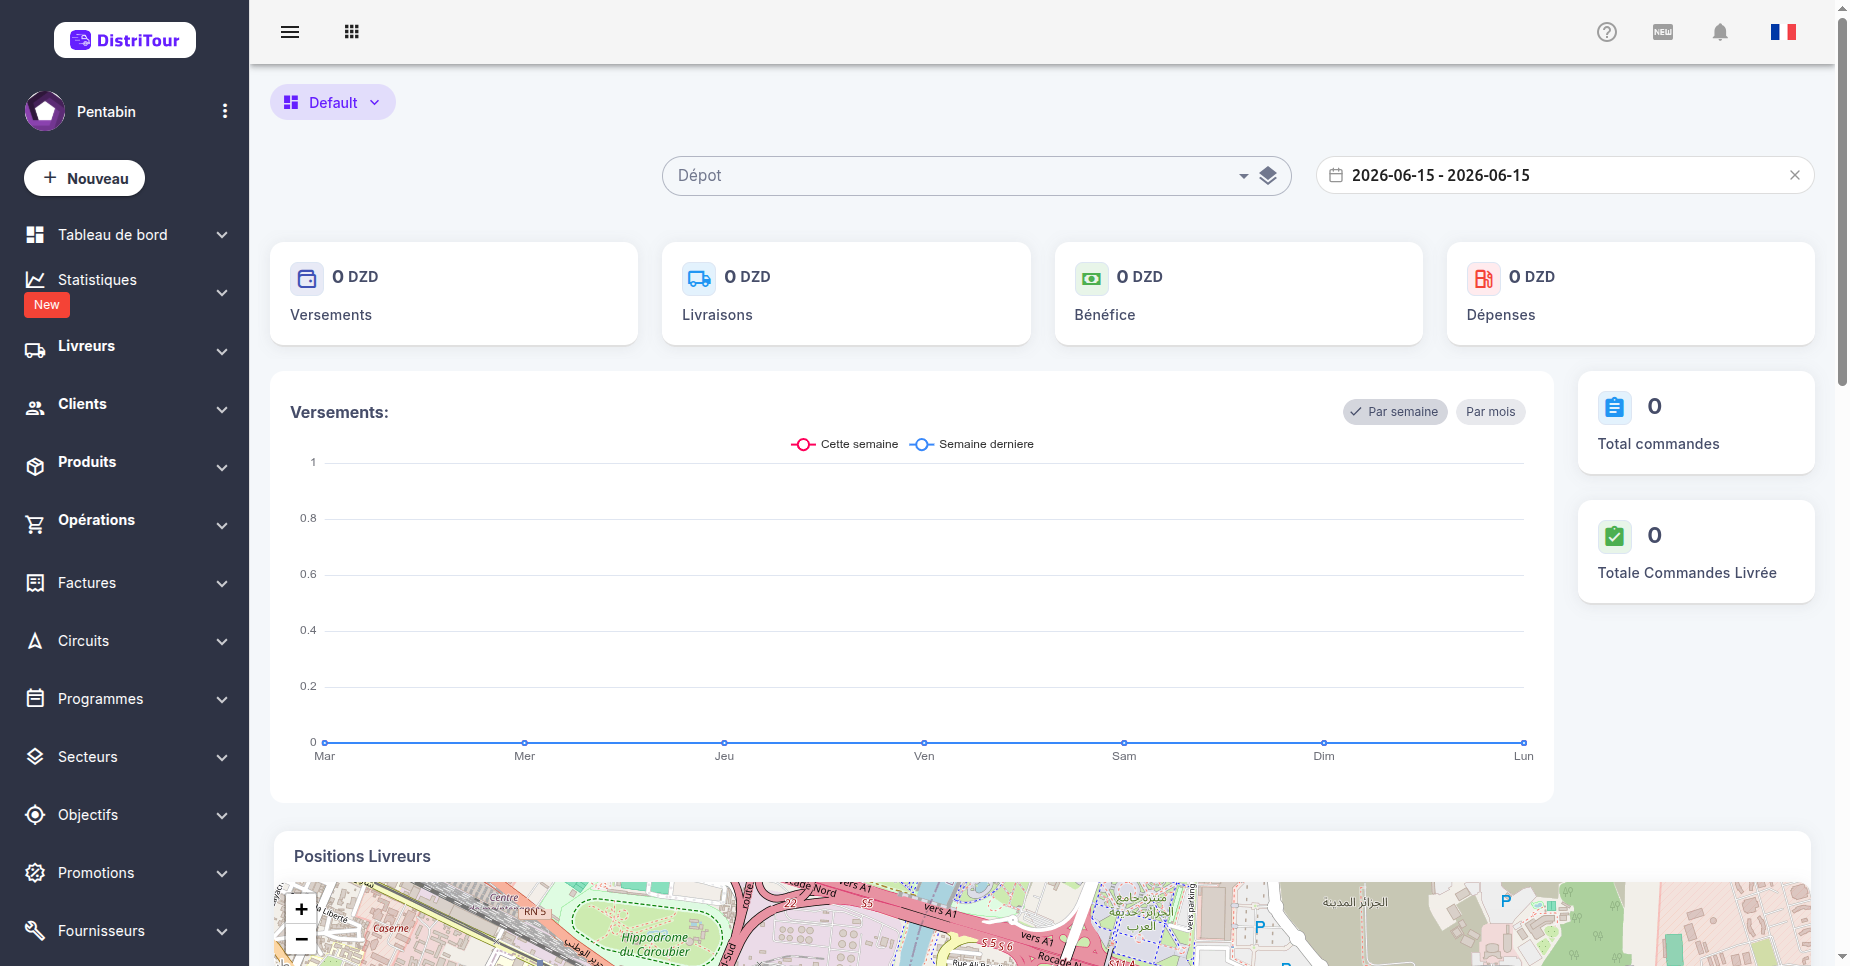
The selector at the top of the page lets you switch between the default dashboard and your custom dashboards.
2. Creating a New Dashboard
- Click the dashboard selector at the top left (the button showing the active dashboard name).
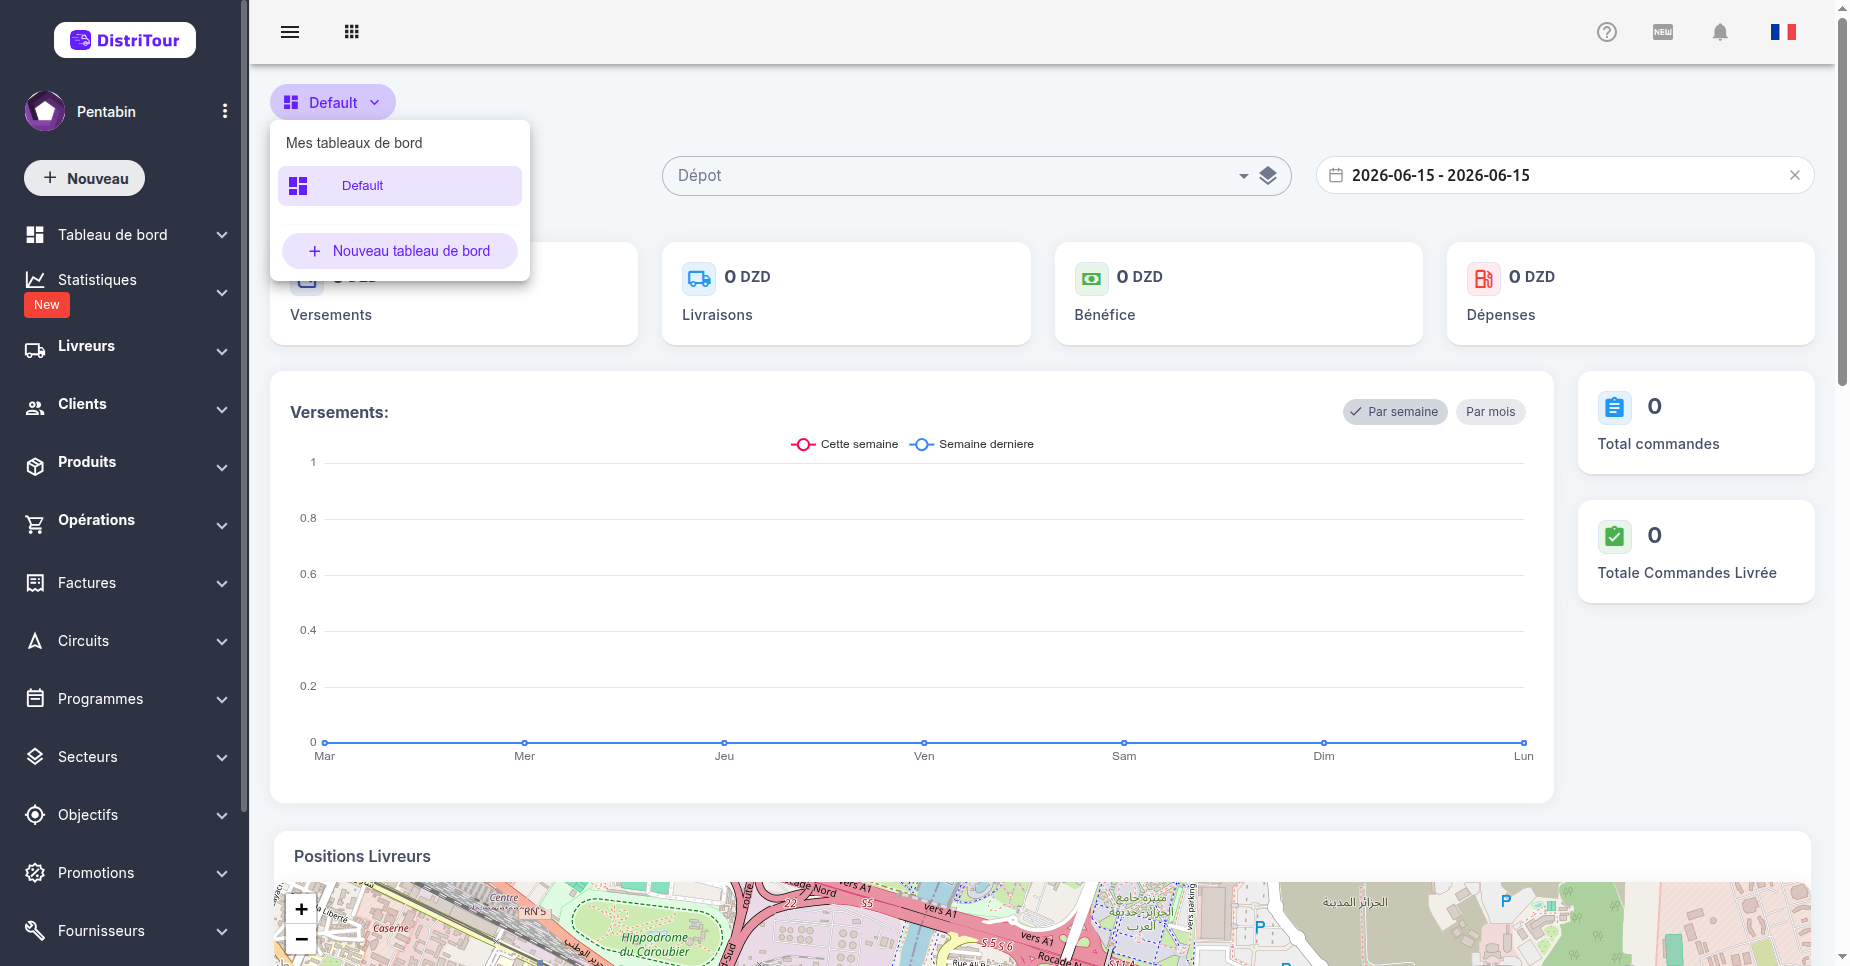
In the dropdown menu, click New Dashboard.
Enter a name for your dashboard.
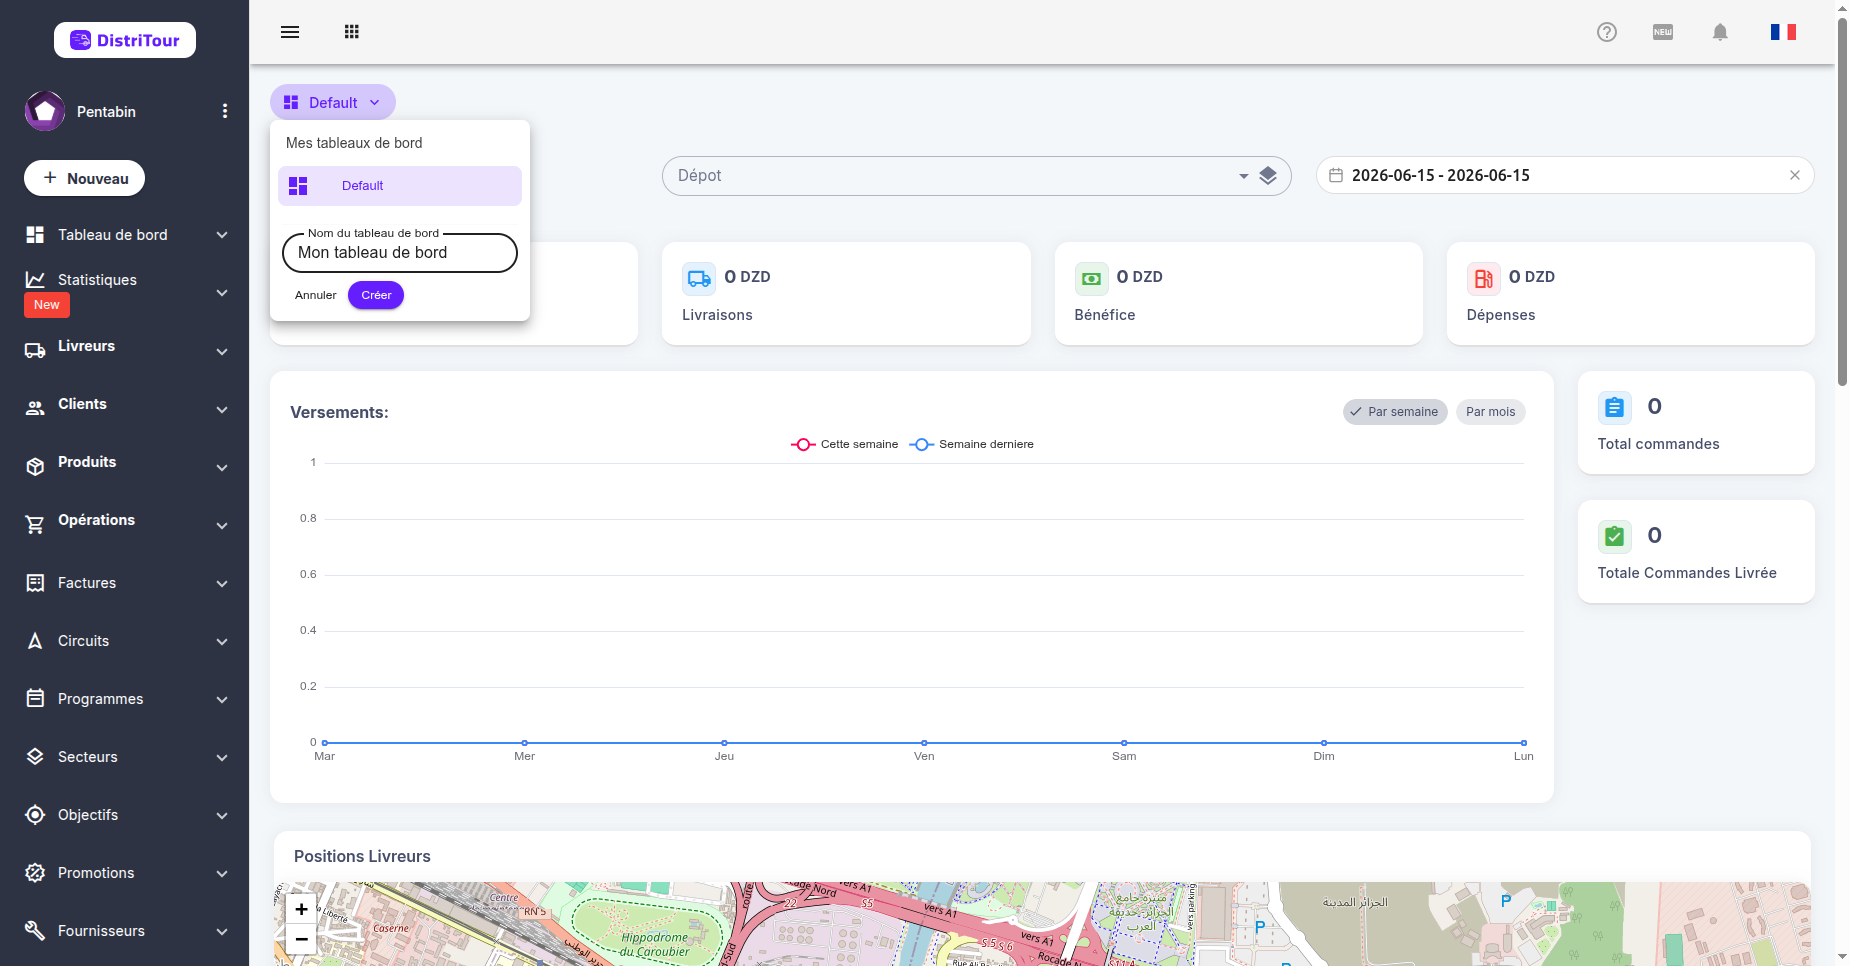
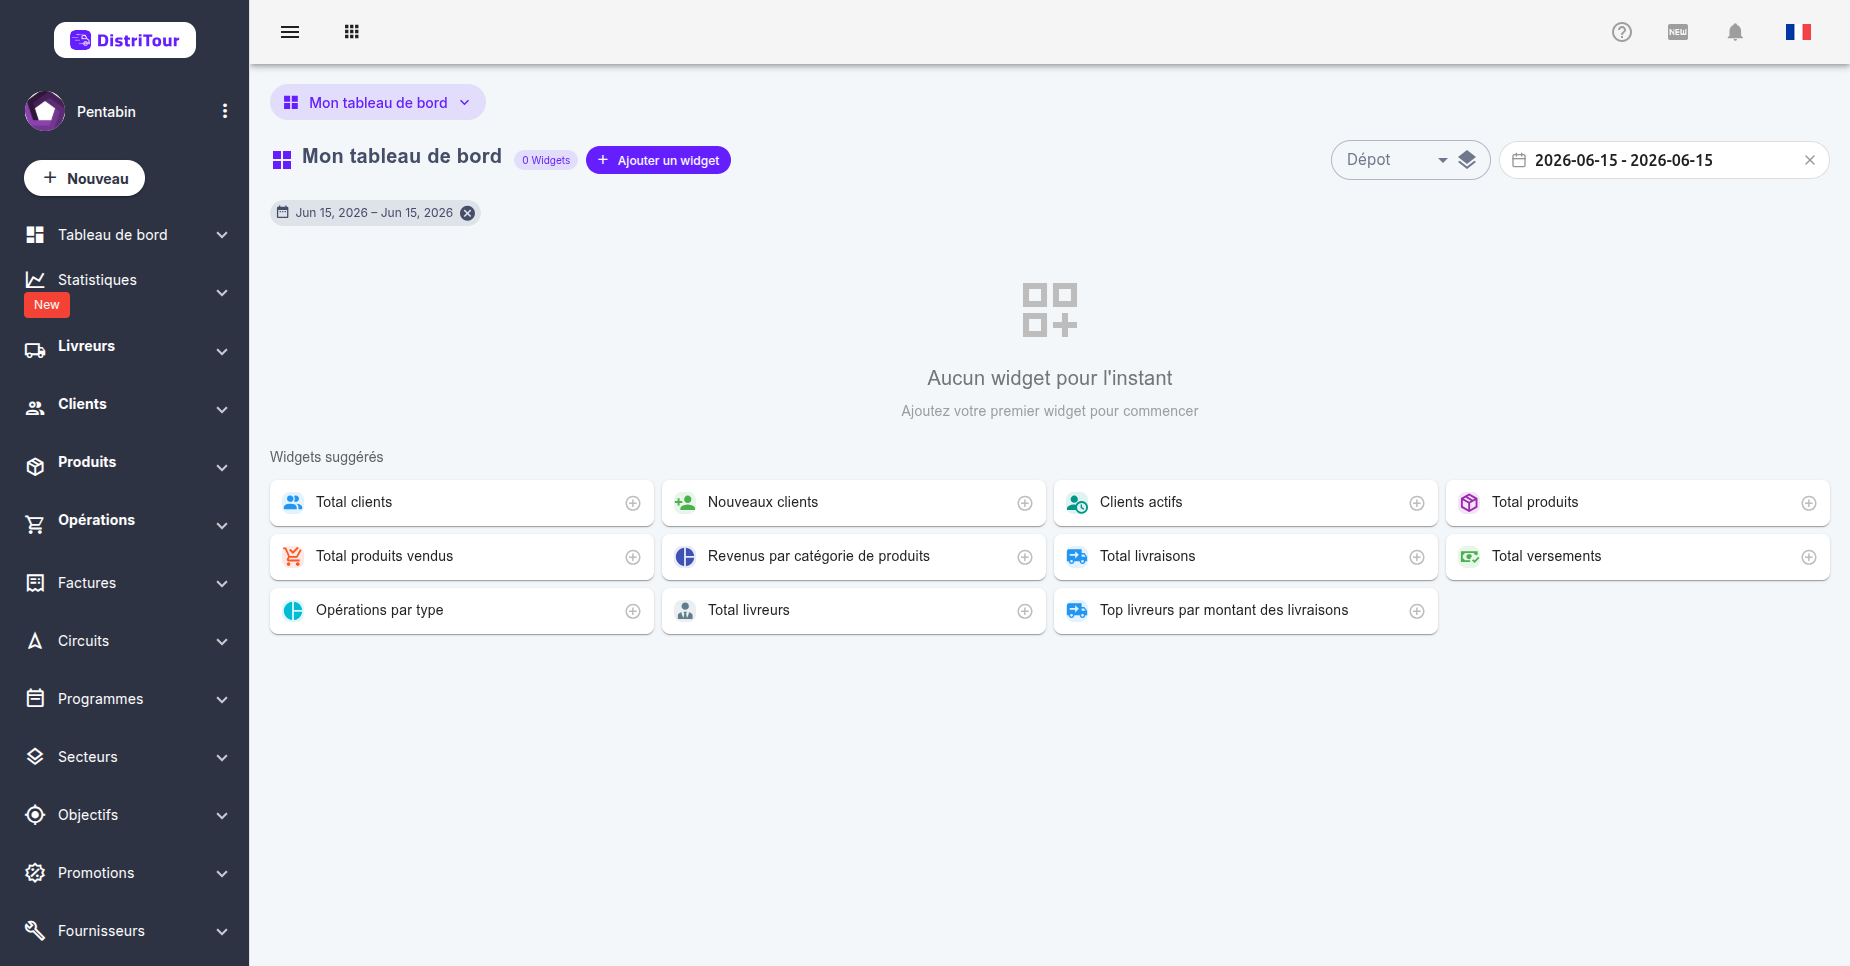
- Click Create. The new dashboard opens immediately, empty and ready to receive widgets.
TIP
Your dashboards are automatically saved in your browser and persist between sessions.
3. Adding a Widget
From any custom dashboard (empty or with existing widgets), click the + Add Widget button.
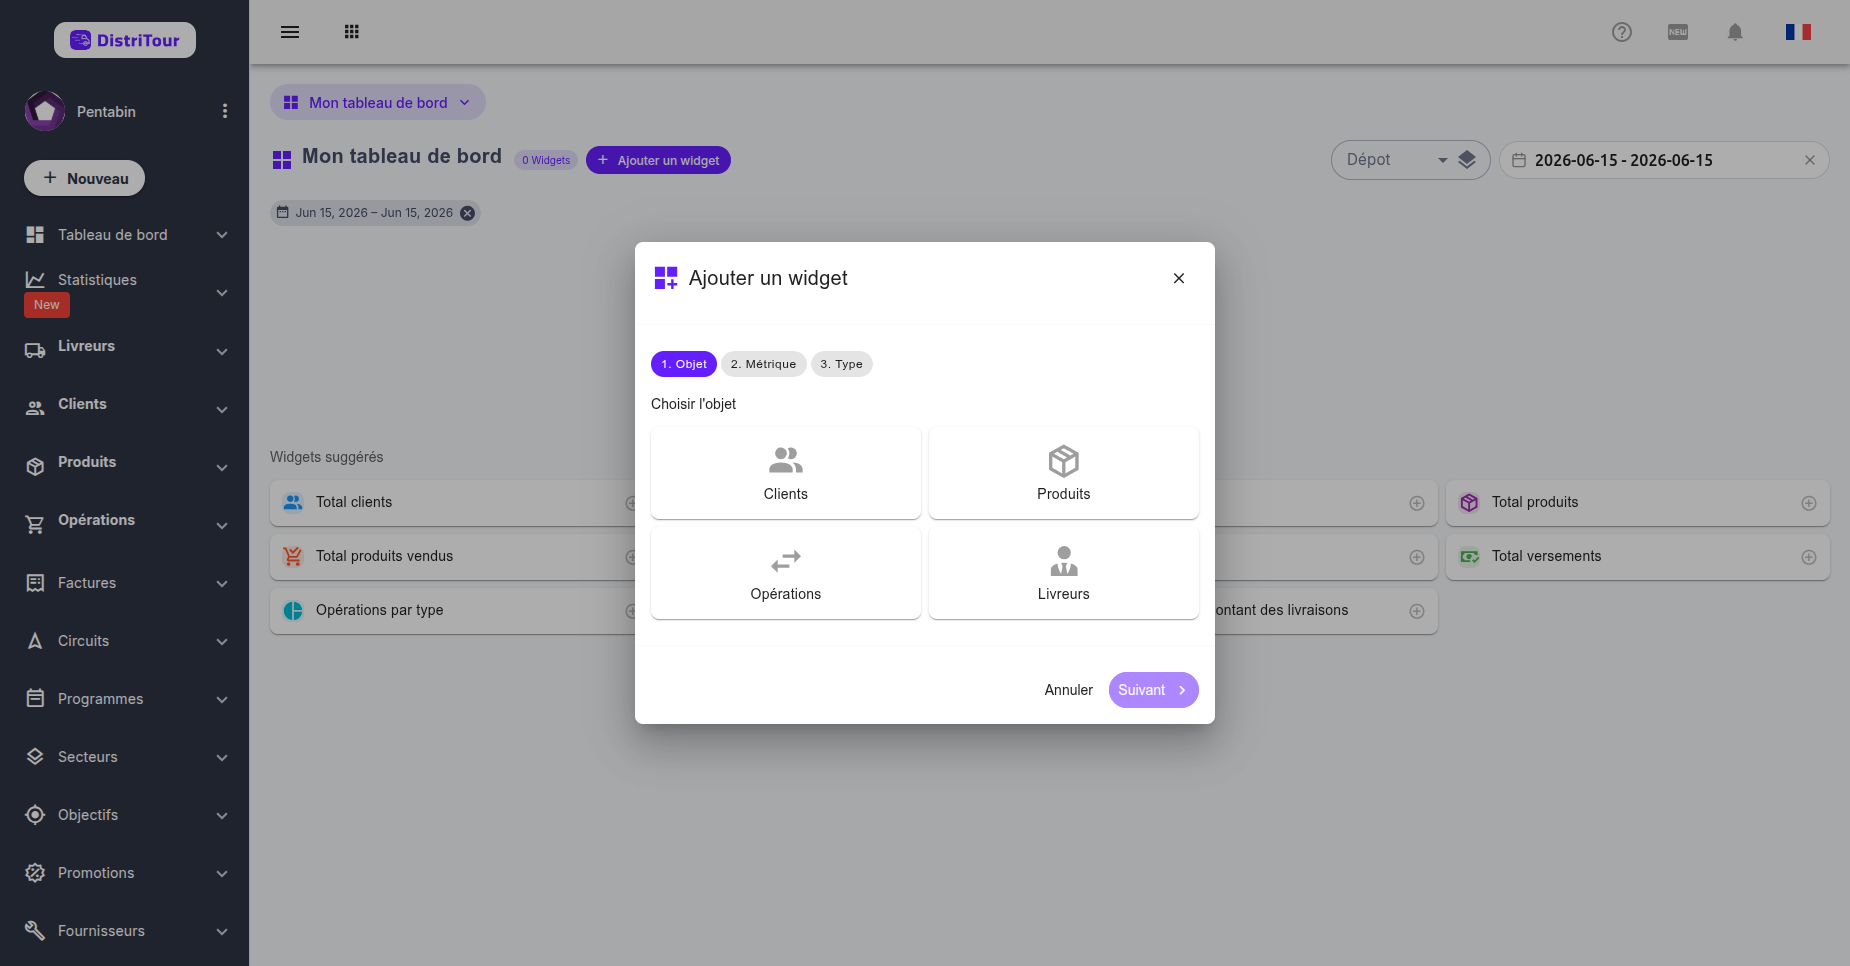
The widget wizard runs in 3 steps:
- Object — which data category?
- Metric — which specific indicator?
- Type — which visualization?
4. Step 1 — Choose an Object
Select the data category you want to display:
| Object | Description |
|---|---|
| Clients | Data related to your client portfolio |
| Products | Data related to your products and sales |
| Operations | Deliveries, payments, orders, visits |
| Carriers | Performance and activity of your carriers |
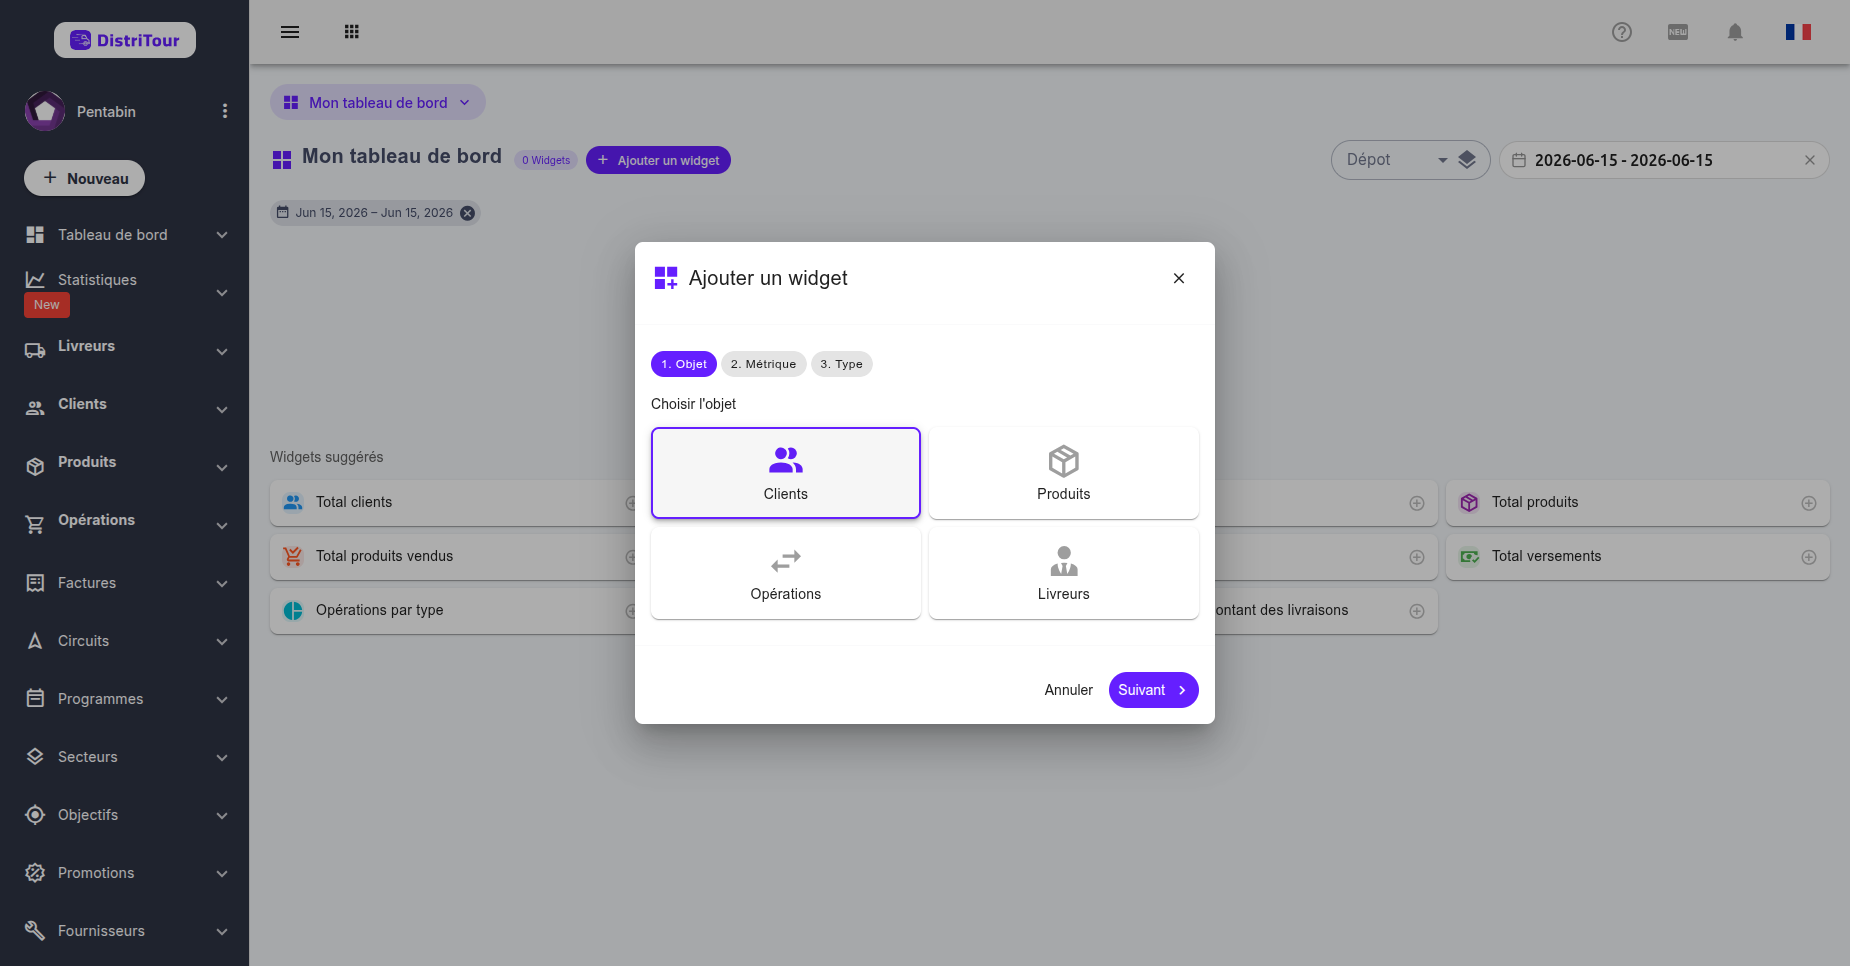
Click the desired object then click Next.
5. Step 2 — Choose a Metric
Select the specific indicator to display for the chosen object.
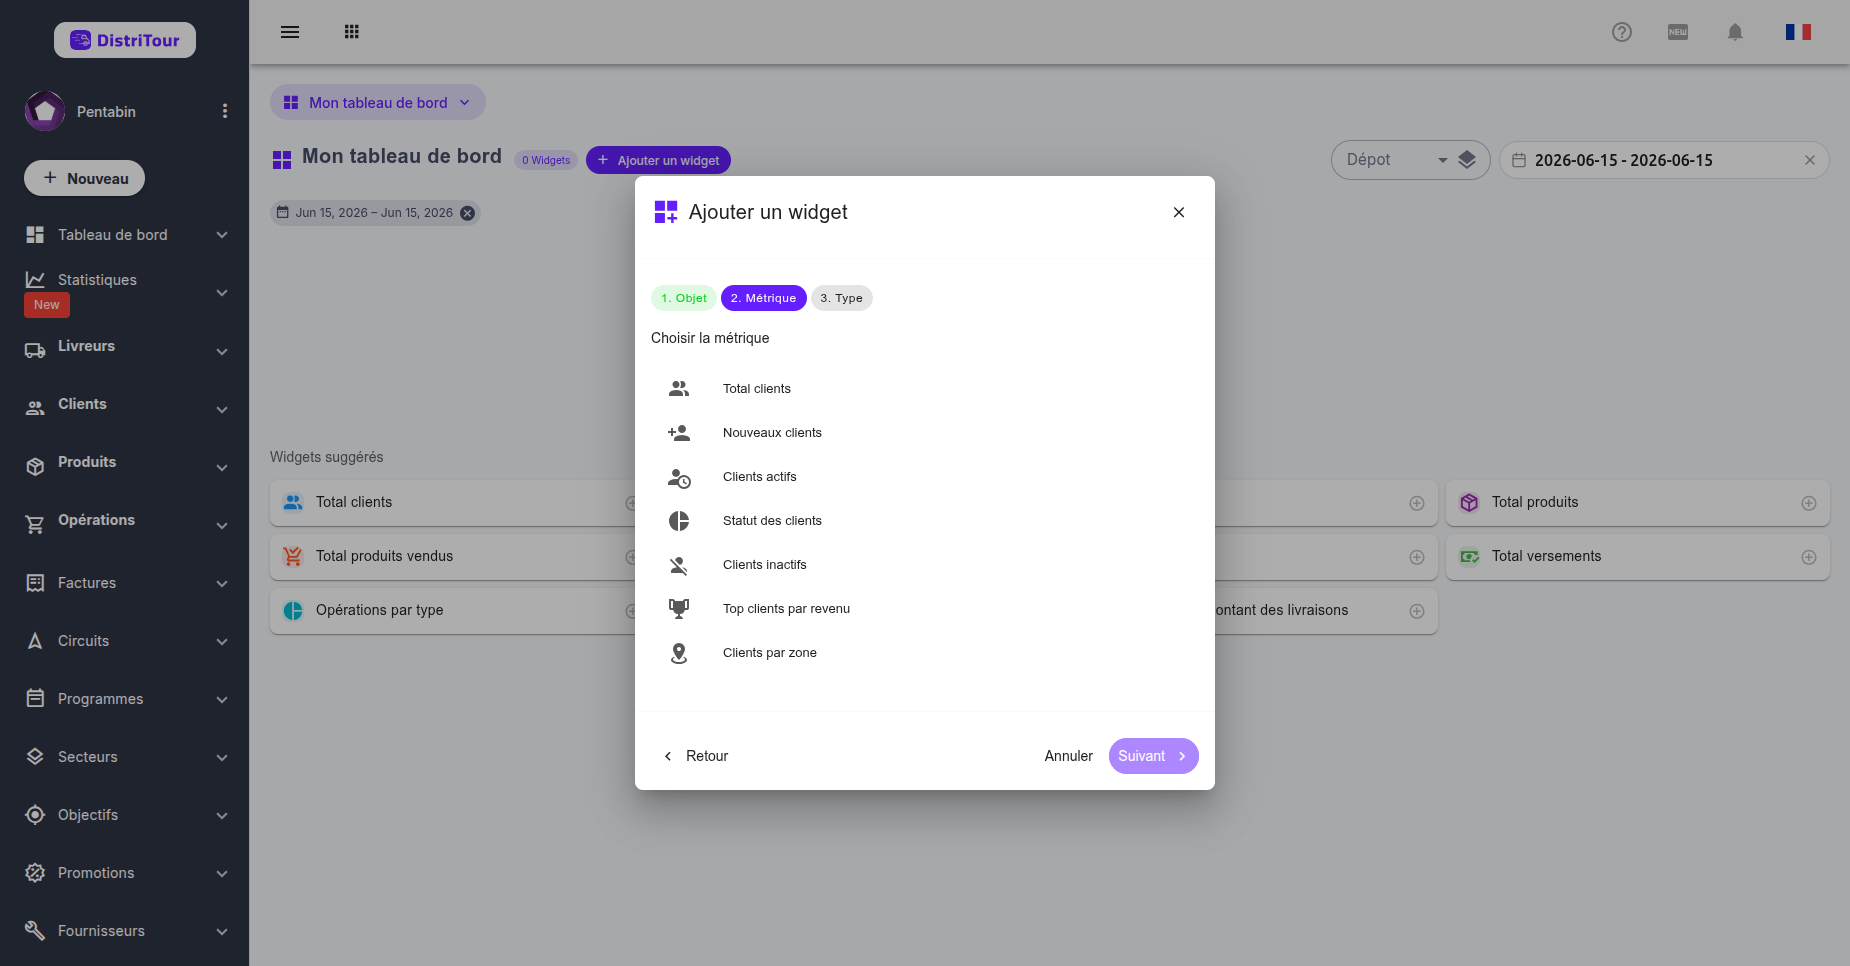
Examples of available metrics by object:
Clients
- Total clients
- New clients
- Active clients
- Churned clients
- Top clients by revenue
- Clients by zone
Products
- Total products
- Total products sold
- Top products by quantity / revenue
- Revenue by category
Operations
- Total deliveries / payments / orders / visits
- Deliveries / payments / orders amount
- Total benefits / expenses
- Operations by type
Carriers
- Total carriers / Active carriers
- Top carriers by deliveries / revenue / orders / payments
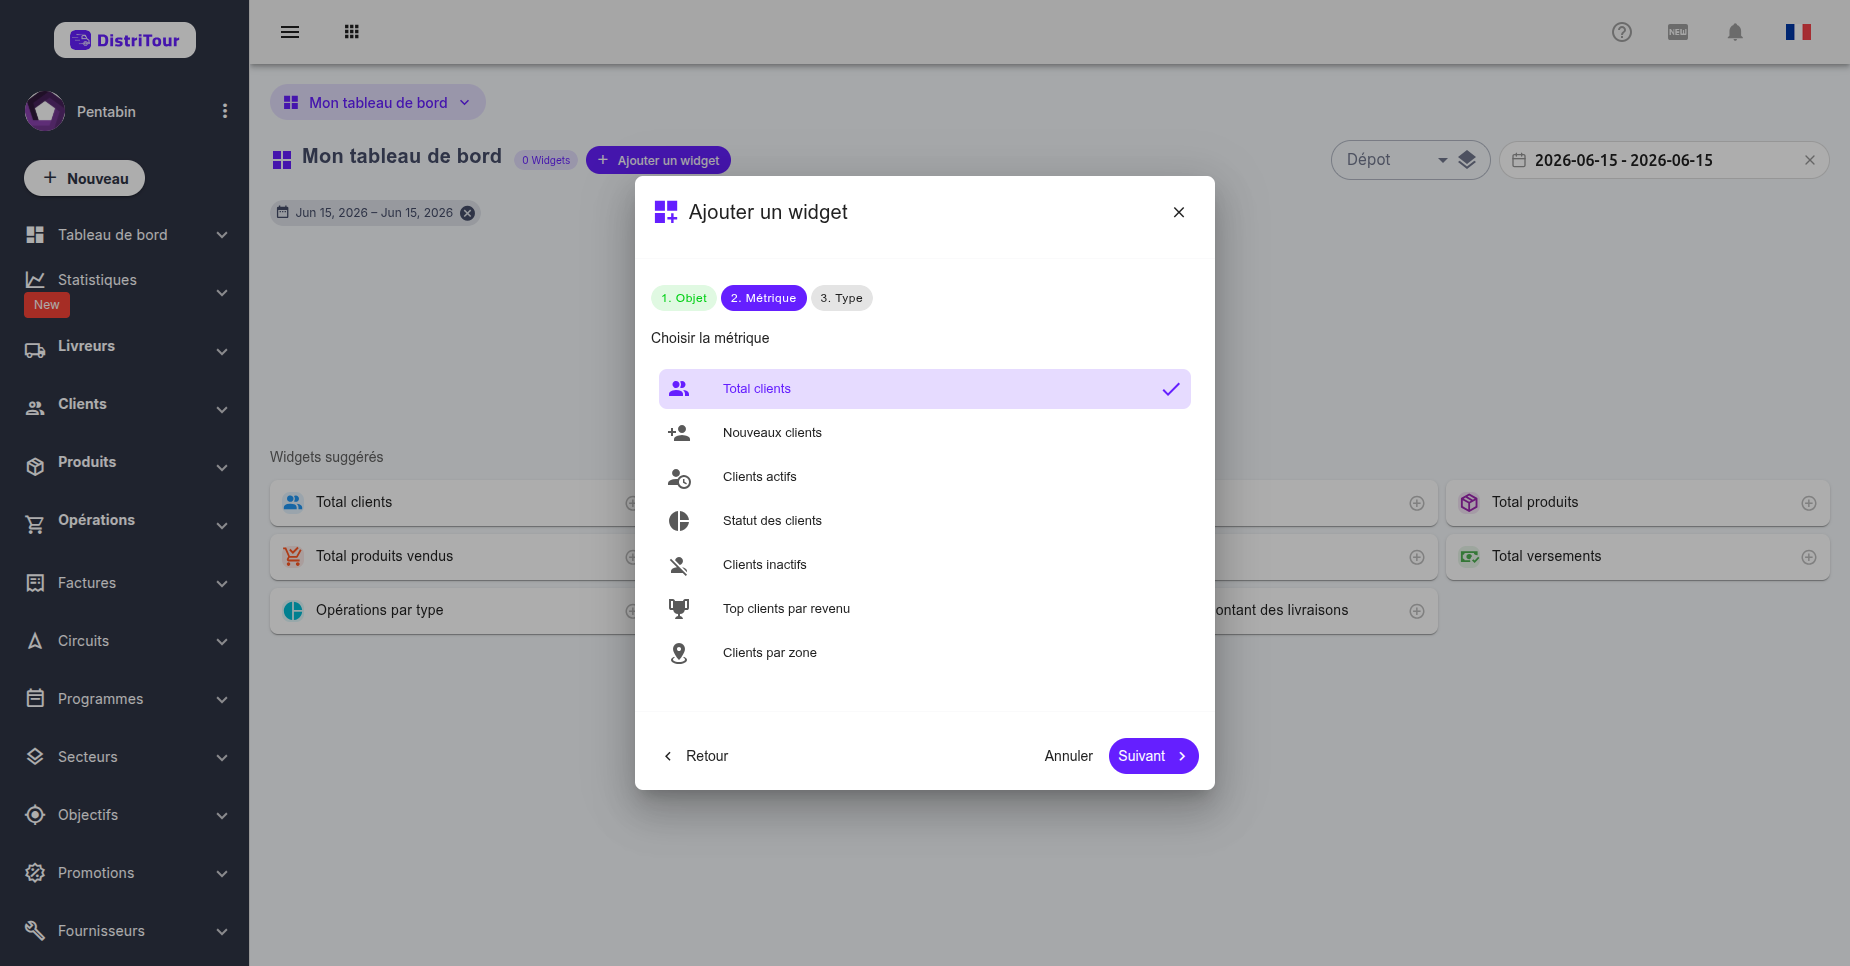
Click the desired metric then click Next.
6. Step 3 — Choose a Widget Type
Select the visualization type. Only types compatible with the chosen metric are shown.
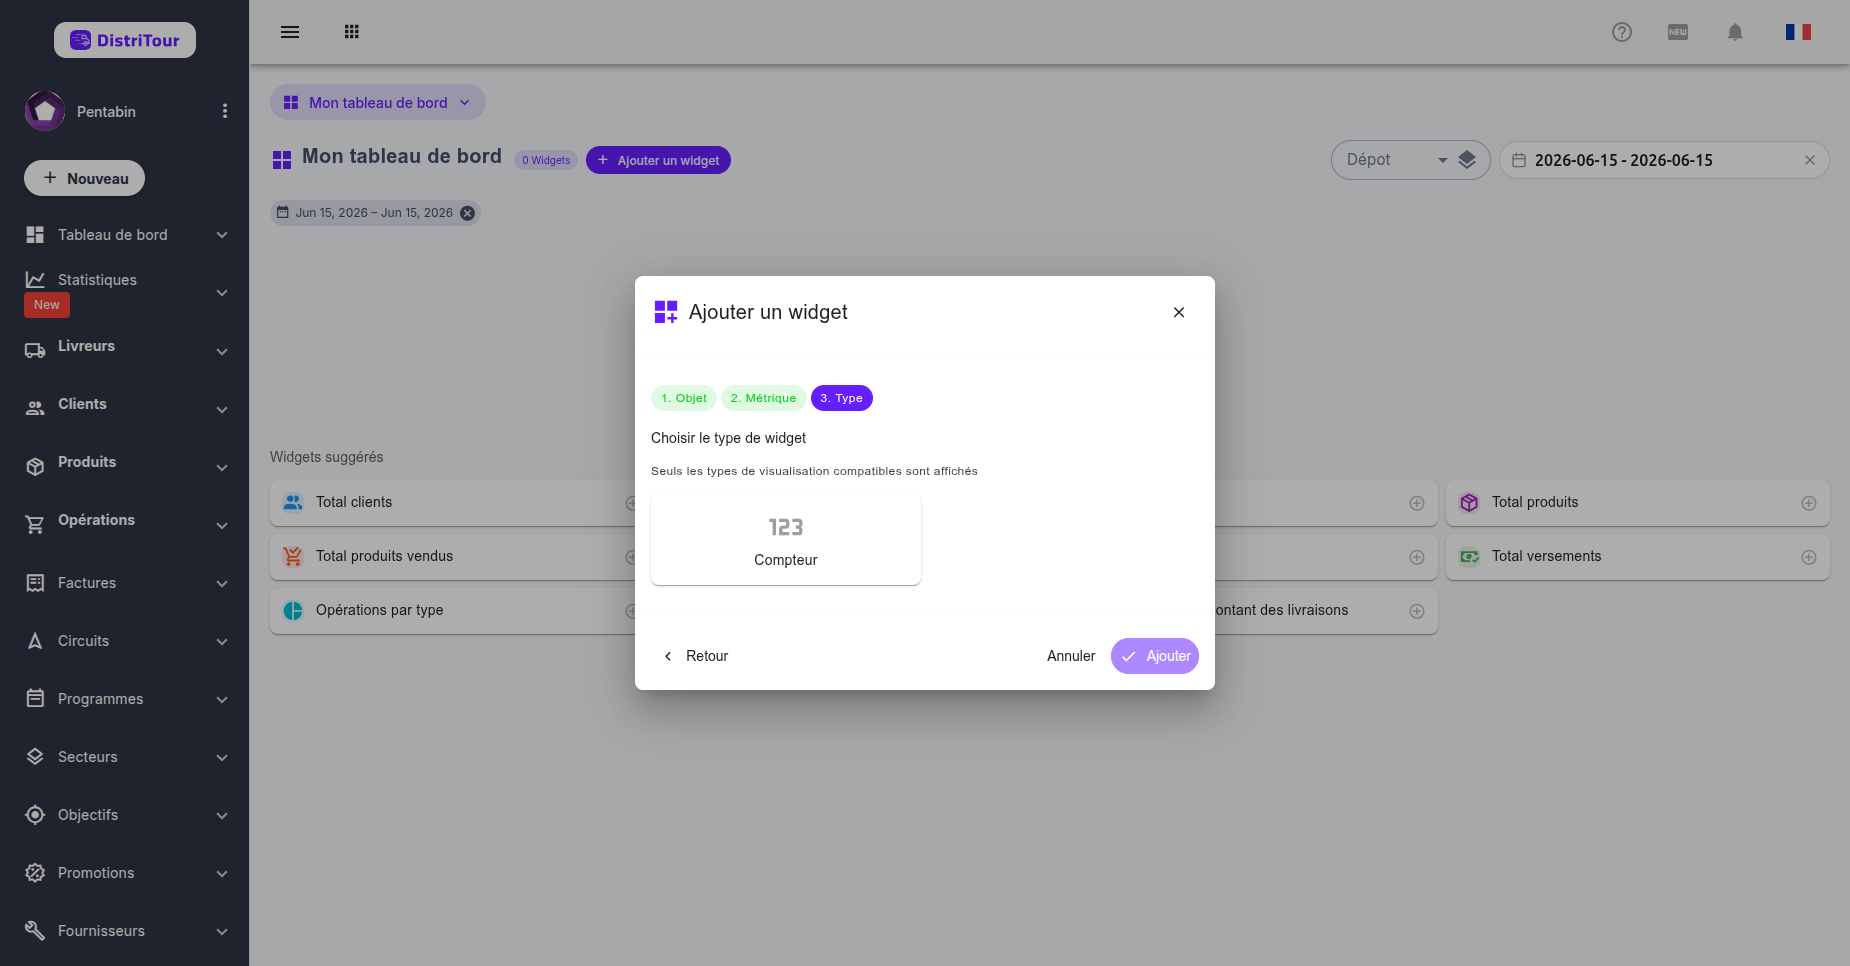
| Type | Description | Best for |
|---|---|---|
| Counter | Displays a single large number | Simple KPIs (e.g. Total clients) |
| Pie Chart | Circular chart for breakdowns | Distribution (e.g. Operations by type) |
| Bar Chart | Bar chart for comparisons | Rankings (e.g. Top products) |
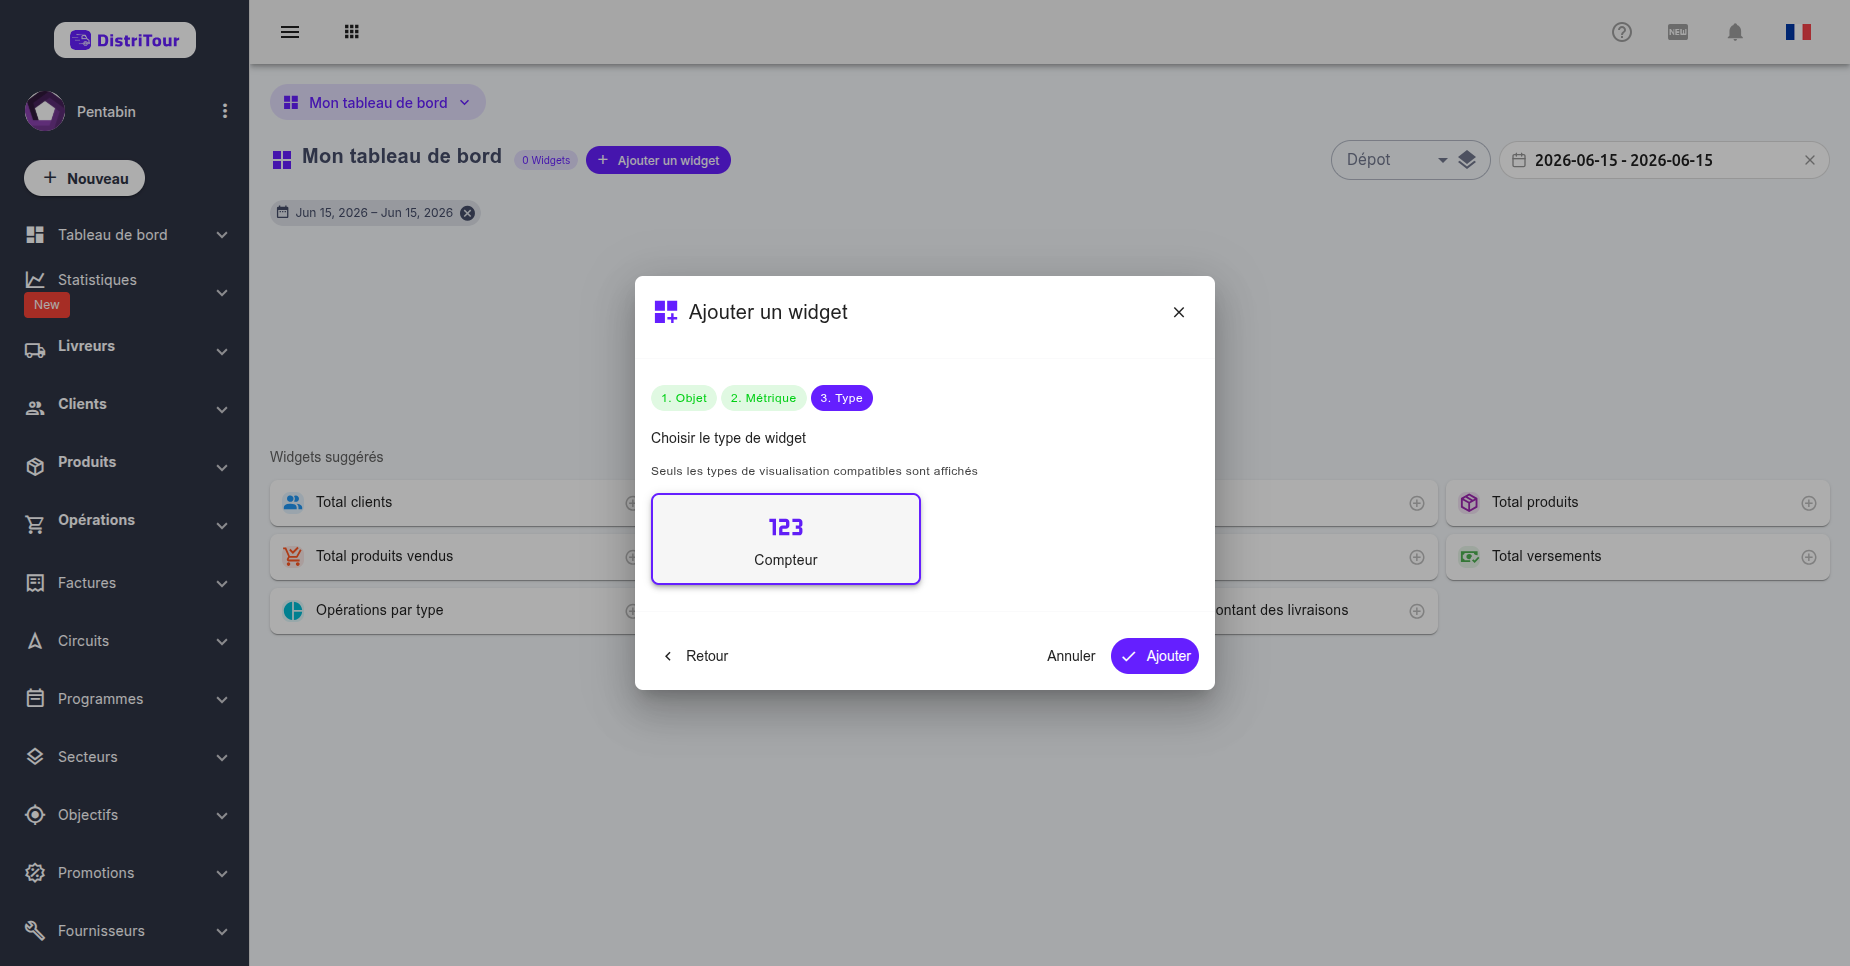
Click the desired type then click Add. The widget appears immediately on your dashboard.
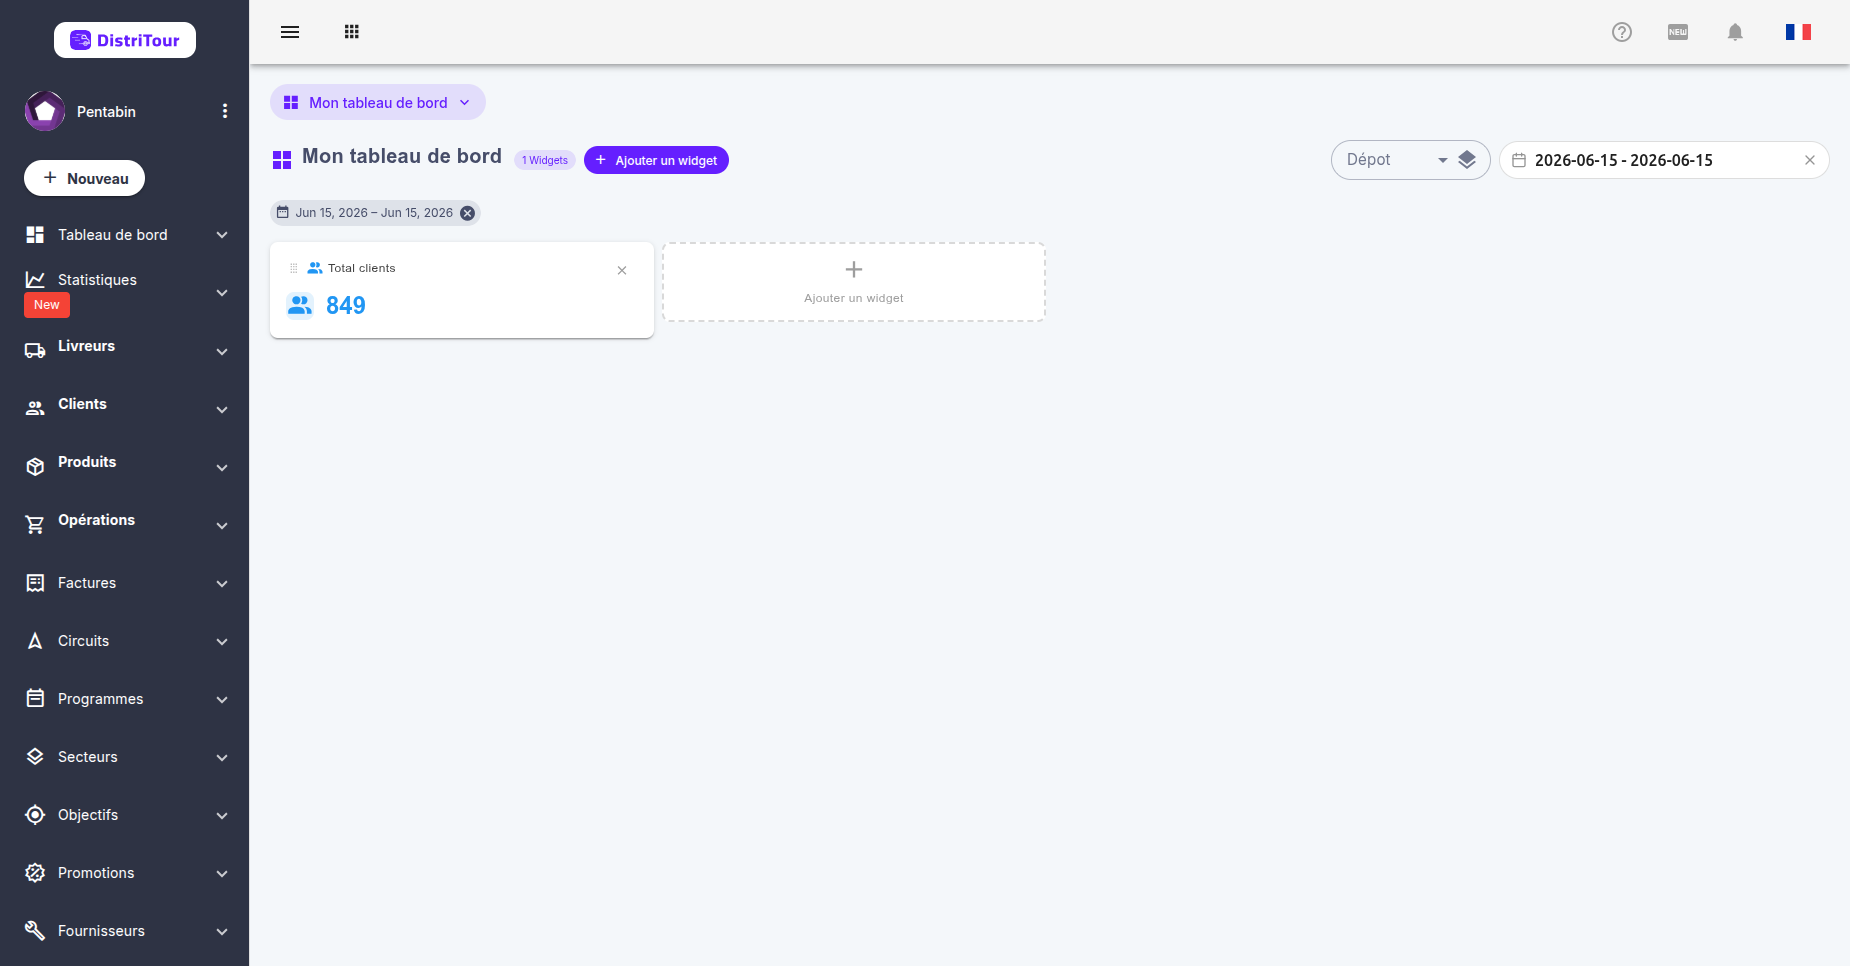
7. Rearranging Widgets (Drag & Drop)
You can freely rearrange your widgets using drag and drop:
- Hover over a widget — a drag handle icon (⠿) appears at the top left.
- Click and hold that icon.
- Drag the widget to its new position.
- Release — the order is automatically saved.
TIP
Only the ⠿ icon triggers drag and drop. You can click anywhere else on the widget normally without accidentally moving it.
8. Filtering by Date and Zone
At the top of any custom dashboard, two filters apply to all widgets simultaneously:
- Date filter — select a date range (today, this month, last 3 months, etc.)
- Zone filter — restrict data to a specific geographic zone (if zones are enabled on your account)
When a filter is active, a chip appears below the controls showing the active filter. Click the × on the chip to remove it.
9. Removing a Widget
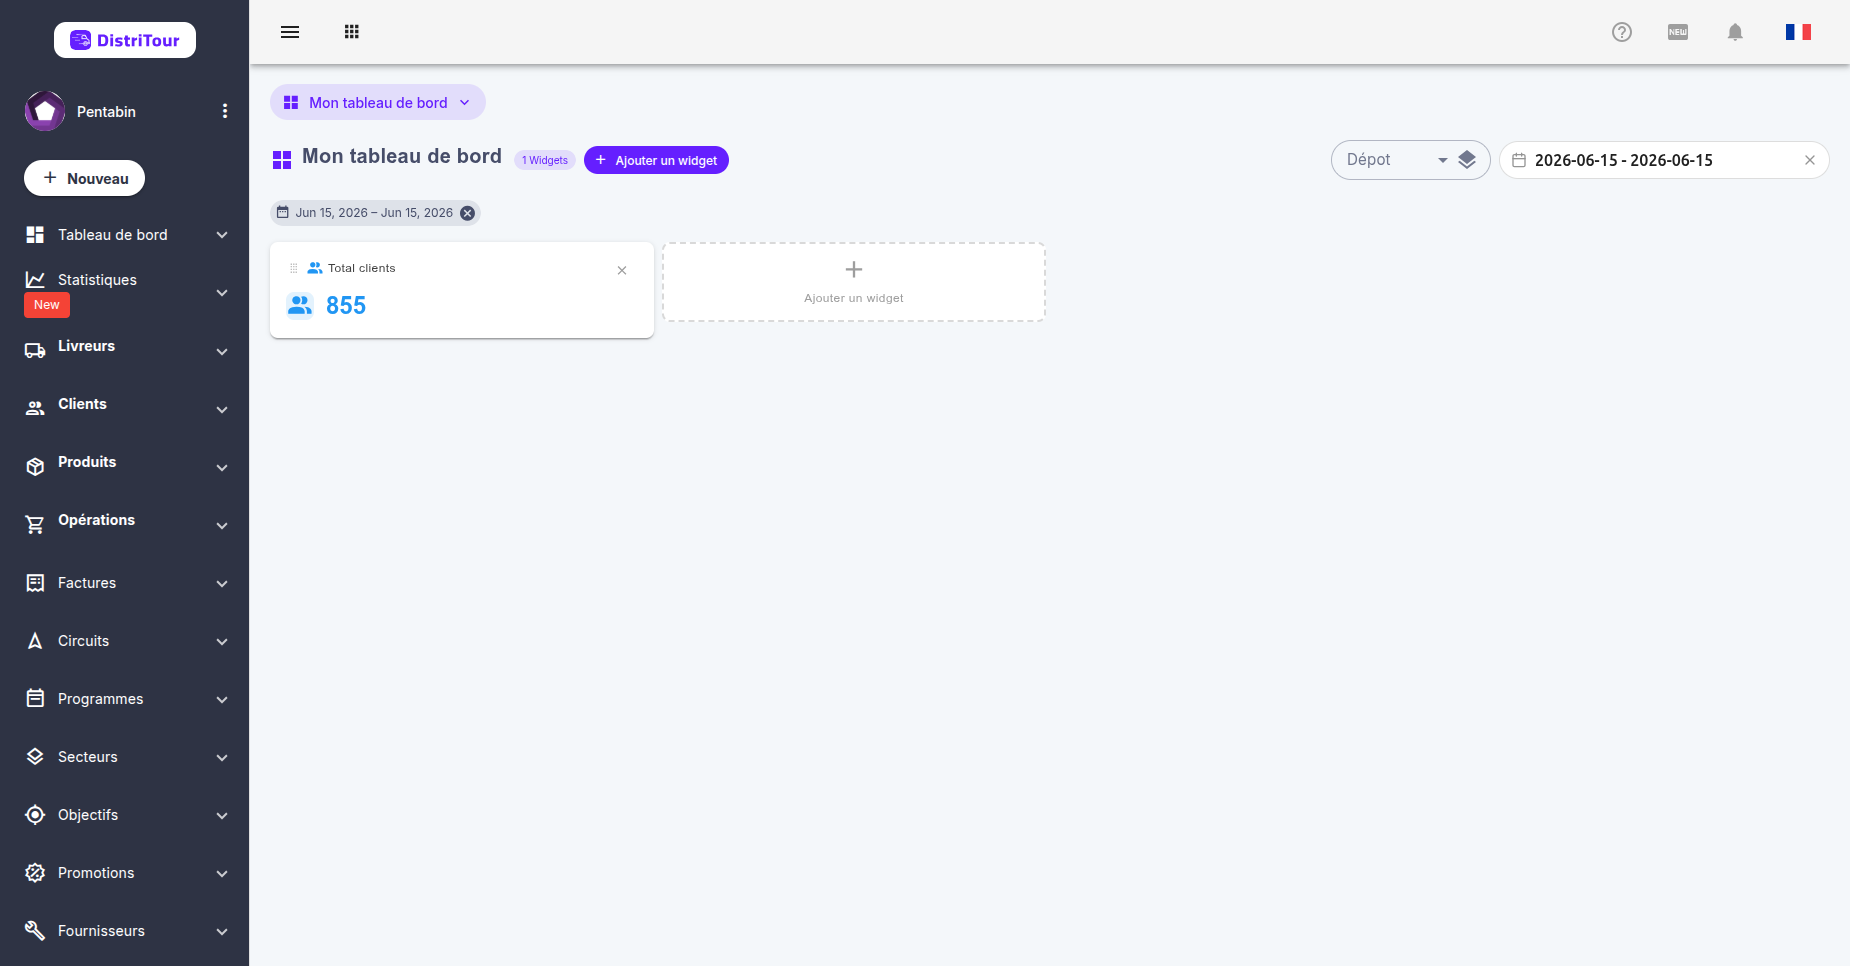
To remove a widget from the dashboard, click the × button at the top right of the widget. Removal is instant and automatically saved.
10. Renaming or Deleting a Dashboard
- Click the dashboard selector at the top left.
- In the list, hover over the dashboard you want to modify.
- Use the available icons to rename ✏️ or delete 🗑️ it.
WARNING
The Default dashboard cannot be renamed or deleted.